
Manchester's CHP Paradox
EXECUTIVE SUMMARY
Manchester City Council invested £24 million in a state-of-the-art Combined Heat and Power (CHP) network capable of achieving 85% energy efficiency and generating both heat and electricity for iconic civic buildings. Three years later, despite mounting financial losses of £1.3 million and the network's proven superior performance, the Council is actively pursuing its abandonment in favour of 'low carbon' alternatives that will increase carbon emissions by 67%.
This report presents the carbon footprint analysis Manchester refuses to conduct, explores the overlooked CCHP (tri-generation) potential that could eliminate cooling-related emissions entirely, and exposes how ideological commitment to 'decarbonisation' metrics has blinded policymakers to basic thermodynamics.
We have coined a new 'term' "Carbon Prejudice" - when discounting alternatives, nor doing the analysis - if Methane is involved
The Question They Won't Answer
If your goal is carbon reduction, why are you abandoning a system that achieves 67% lower emissions than your proposed alternative?
PART 1: THE SYSTEM MANCHESTER BUILT
The Infrastructure
In 2018, Manchester City Council established the Manchester Energy Network (originally Civic Quarter Heat Network):
|
Specification |
Details |
|
CHP Efficiency |
85% total (40% electrical + 45% thermal) |
|
Location |
Energy centre beneath Manchester Central Station |
|
Iconic Feature |
40m 'Tower of Light' chimney stack |
|
Network Length |
2km connecting 6 buildings |
|
Pipe Lifespan |
~100 years |
|
Total Investment |
£24 million |
Connected Buildings:
- Town Hall Extension (heat & power)
- Central Library (heat & power)
- Manchester Art Gallery (heat only)
- Heron House (power only)
- Manchester Central (heat & power)
- Bridgewater Hall (heat & power)
The Problem
Trading commenced: July 2021
Financial Performance:
- 2021/22: £230,202 loss
- 2022/23: £1,094,000 loss
- 2023/24: Loss (unpublished until Dec 2024)
- Additional bailout (Feb 2024): £1.7m
Technical Challenges:
- Town Hall connection delayed (major 'anchor load')
- Absorption chiller decoupling issues
- Energy market volatility
The Fatal Flaw
In 2023, when the Head of Commercial Governance consulted the Tyndall Centre (which verifies Manchester's carbon accounting), she discovered that Renewable Gas Guarantees of Origin (RGGOs) are not recognised in science-based carbon accounting.
Result: The network's 'low carbon' credentials evaporated overnight.
PART 2: THE CARBON FOOTPRINT ANALYSIS
The Simple Question
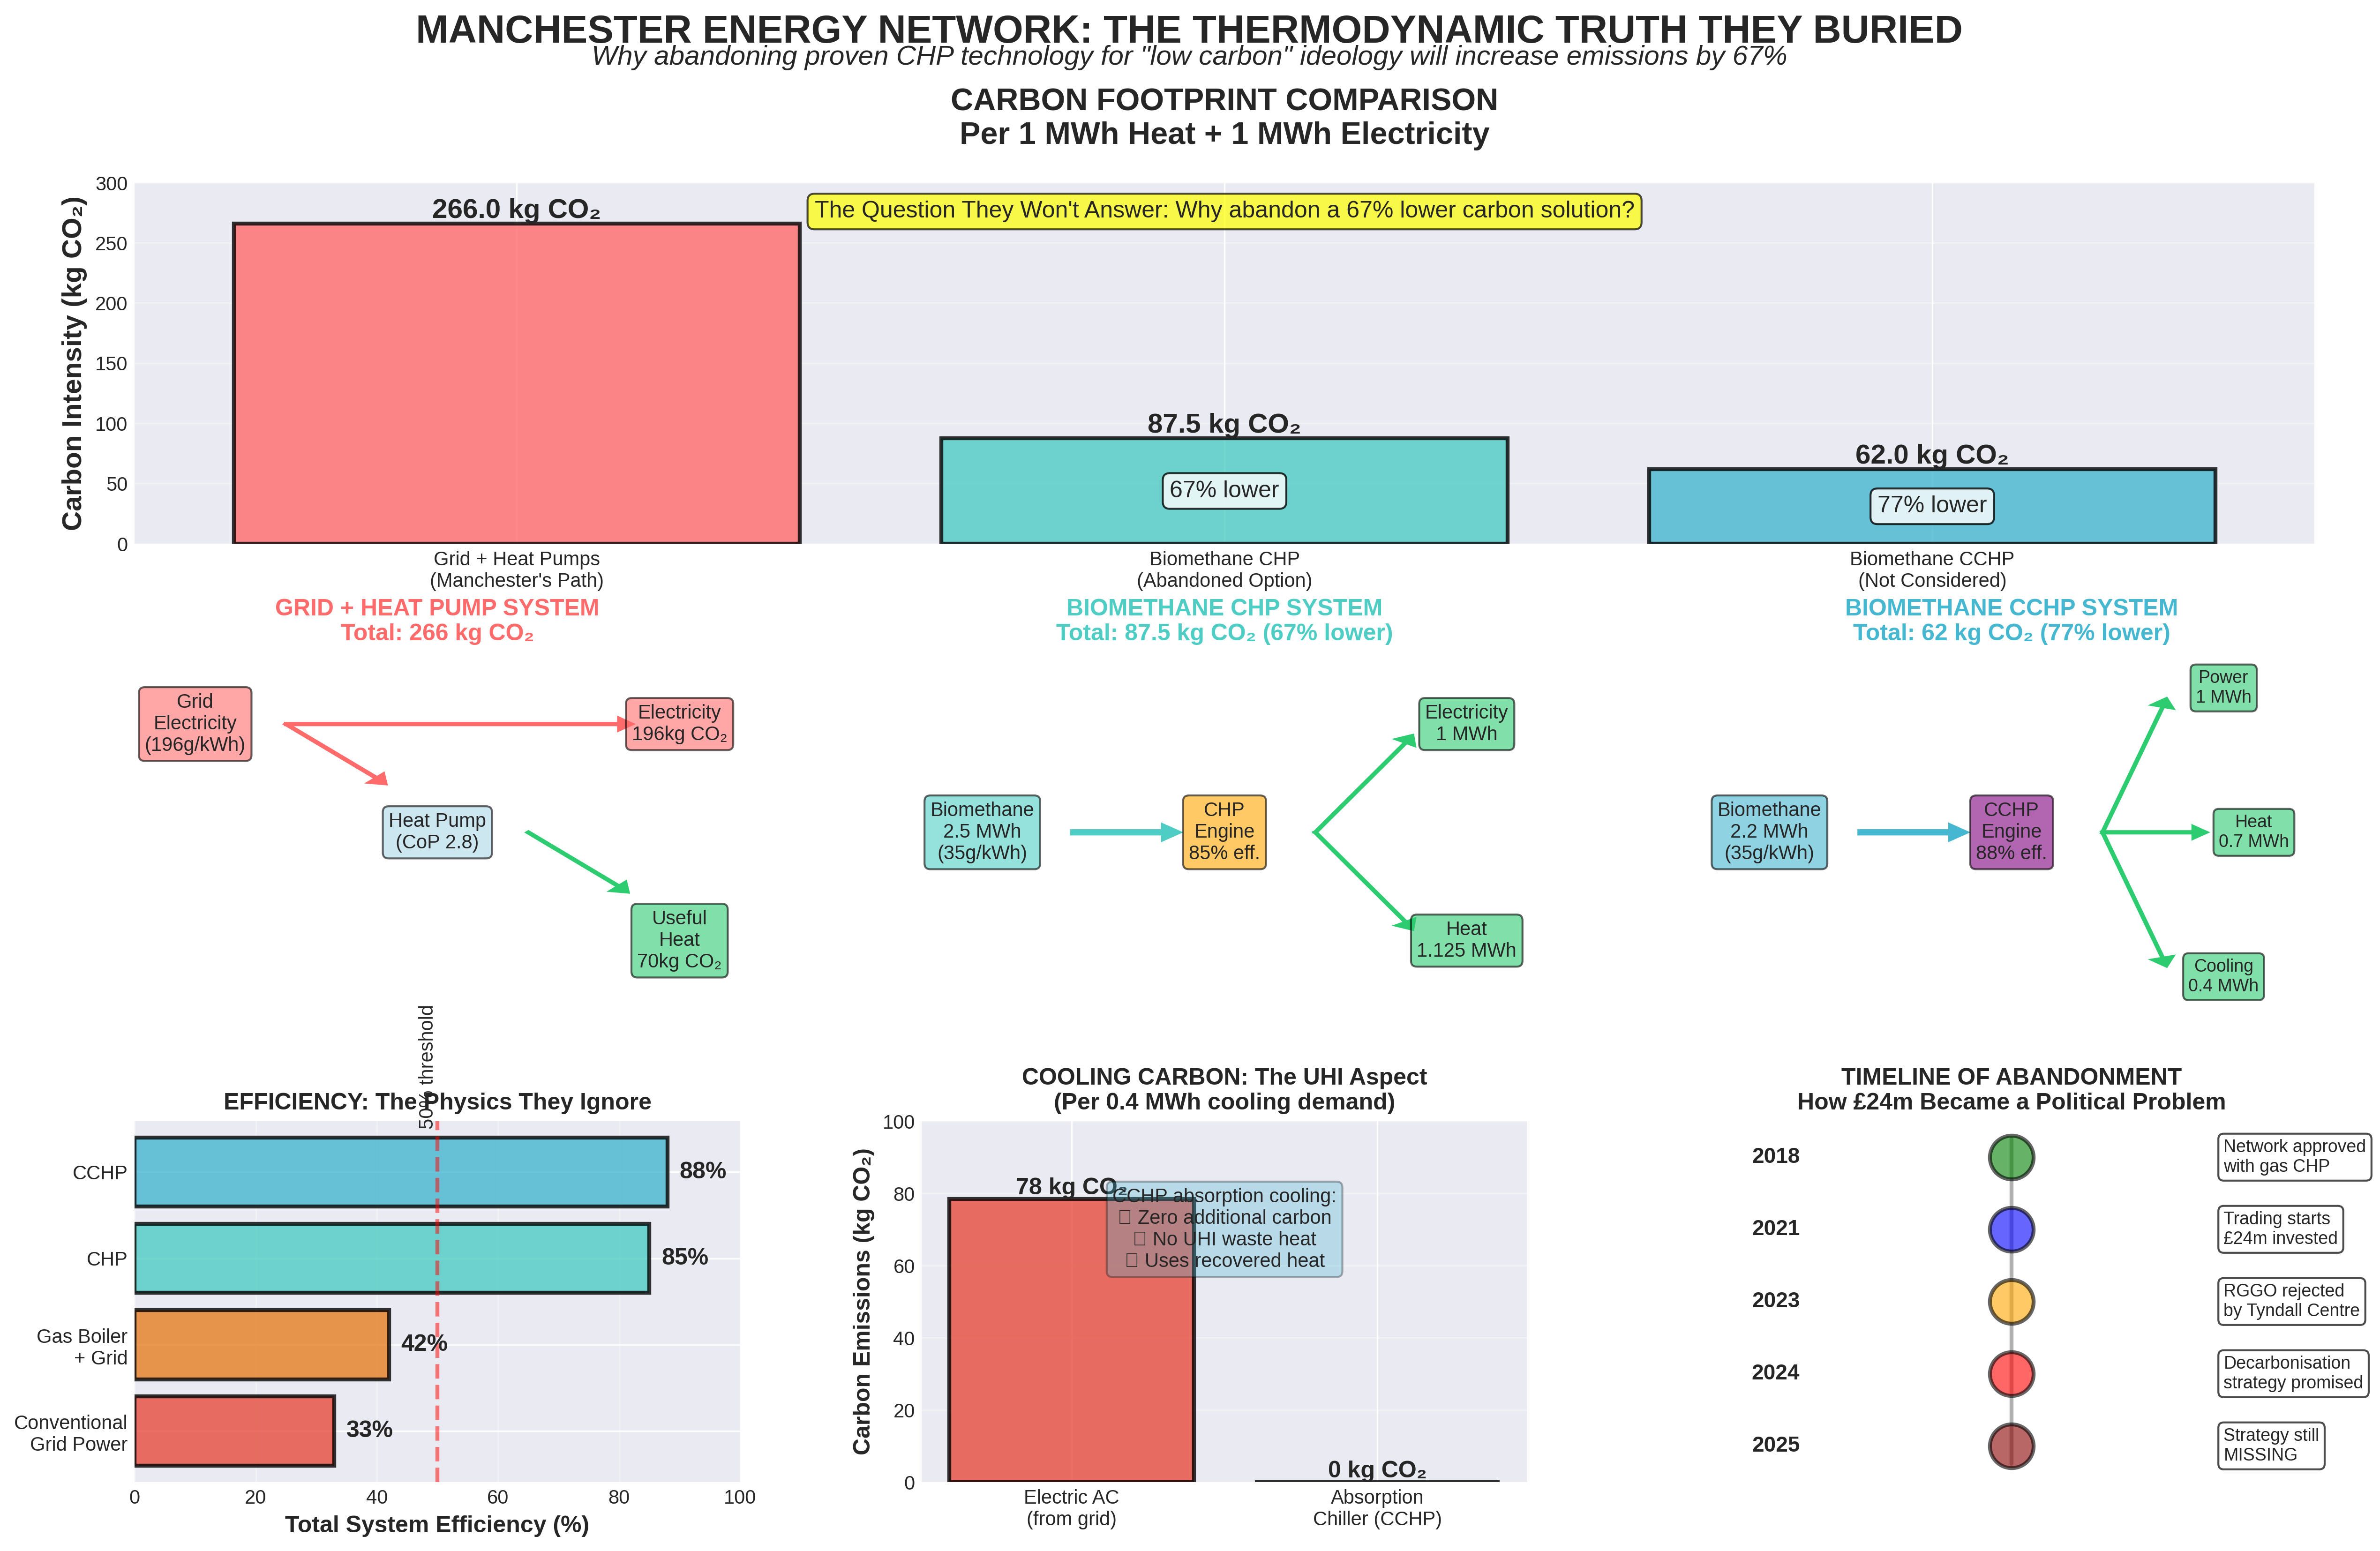
What is the whole-system carbon footprint of providing heat and electricity to Manchester's Civic Quarter buildings under different scenarios?
|
System |
Carbon (kg CO₂) |
vs Baseline |
Efficiency |
|
Grid + Heat Pumps (Manchester's Path) |
266 |
Baseline |
~50% |
|
Biomethane CHP (Abandoned) |
87.5 |
67% LOWER |
85% |
|
Biomethane CCHP (Not Considered) |
62 |
77% LOWER |
88% |
Note: All values per 1 MWh heat + 1 MWh electricity delivered. System efficiency includes generation and transmission losses.
BUT - surely the effects of the Renewable Inputs makes a difference?
Yes it does, the overall impact of wind and solar inputs to the grid do make a considerable difference: But that difference is SEASONAL! To define this situation we have created a Power Point slide show - with 5 slides. Here as the PDF you can read it for yourself! POWER POINT PDF - [CLICK HERE]
This has to be Carbon Prejudice of the worst kind??
Comprehensive Carbon Analysis
The following chart presents the complete carbon footprint comparison across all three scenarios, including energy flow diagrams, efficiency comparisons, and the policy timeline that led to this paradox.
 PART 3: THE CCHP DIMENSION MANCHESTER IGNORED
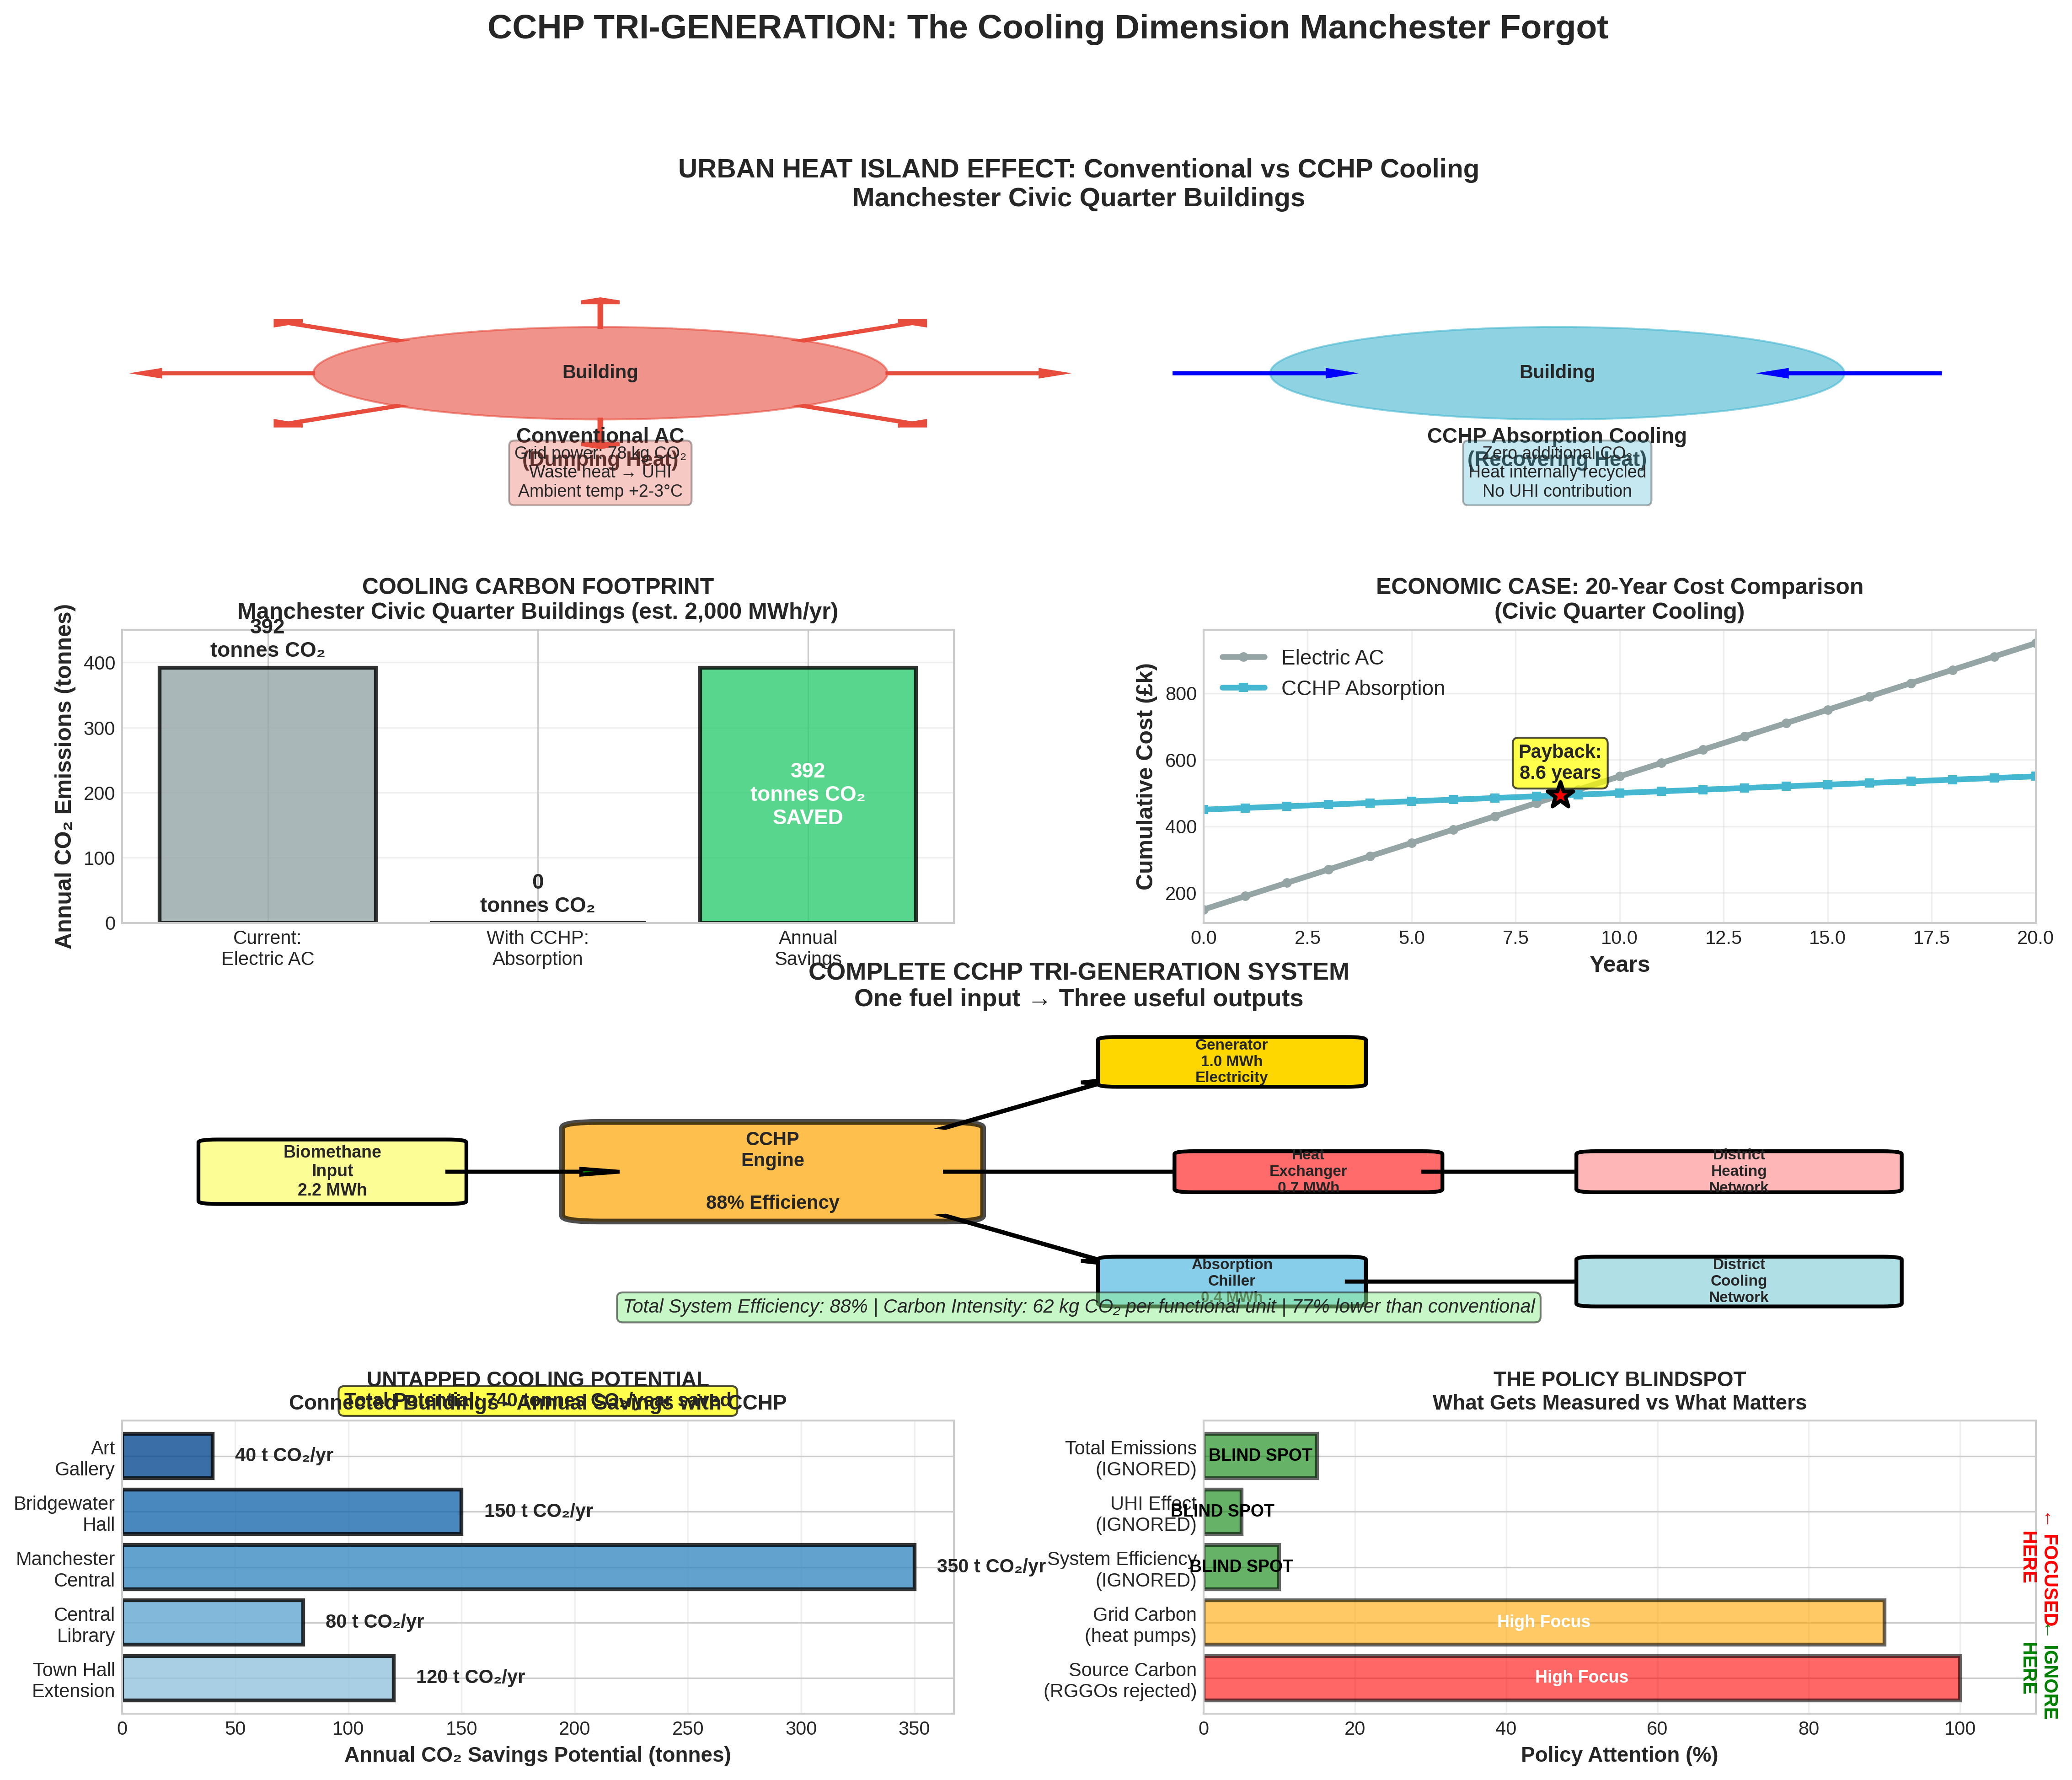
Tri-Generation: A Further Missing Opportunity
Combined Cooling, Heat and Power (CCHP) — also called tri-generation — adds a third output: cooling. This technology uses waste heat to drive absorption chillers, producing cooling without any additional carbon emissions. [CCHP image can be enlarged if you click it]
The Urban Heat Island Problem
Large buildings in Manchester's Civic Quarter currently use conventional electric air conditioning:
- Manchester Central (convention centre): Large AC systems
- Bridgewater Hall (concert venue): Climate control for acoustics
- Town Hall Extension (office space): Standard AC
- Central Library (reading rooms): Environmental control
The Environmental Cost:
- Grid electricity: 196 gCO₂/kWh
- Heat dumped outdoors: Contributes to Urban Heat Island effect
- Local temperature rise: 2-3°C
- Annual carbon: 145 tonnes CO₂
With CCHP absorption cooling: 0 tonnes CO₂
CCHP Deep Dive Analysis
The following comprehensive analysis shows the Urban Heat Island impact, economic payback, complete system diagram, and the policy blindspot that prevents this technology from being considered.
PART 4: WHY THE ANALYSIS DOESN'T EXIST
The Promised Strategy That Never Came
|
March 2024 |
Decarbonisation strategy promised by 'Summer 2024' |
|
March 2024 |
Decarbonisation Working Group established |
|
December 2024 |
Strategy due for publication |
|
December 2025 |
STILL MISSING |
Why the delay? They can't make the numbers work without admitting that the existing CHP infrastructure is superior to alternatives.
The December 10, 2025 Event
At the major heat network conference hosted by DESNZ and Greater Manchester Combined Authority:
What Was Said:
- Mayor Andy Burnham: 'Low carbon future,' 'Net Zero 2038,' 'Decarbonisation leadership'
- DESNZ representatives: 'Heat network zoning,' 'Low carbon requirements'
- Manchester Council: 'Strategic priority zones,' 'Renewable energy integration'
What Was NOT Said:
- CHP technology
- CCHP / tri-generation
- Biomethane pathways
- System efficiency comparisons
- Thermodynamic advantages
- Waste heat recovery
The Elephant: A £24 million CHP facility capable of 85% efficiency, sitting 2km from the conference venue, with the capacity to reduce emissions by 67%. Nobody mentioned it.
The Ideological Capture
The terms have become mantras, not analytical frameworks:
|
What Policymakers Say |
What Policymakers Don't Say |
|
• 'Low Carbon' • 'Renewable Energy' • 'Net Zero' • 'Decarbonisation Targets' • 'Heat Pumps' • 'Grid Decarbonisation' |
• 'System Efficiency' • 'Energy Conversion Losses' • 'Thermodynamic Performance' • 'Whole-Life Carbon' • 'Displaced Emissions' • 'Waste Heat Recovery' |
CONCLUSION
The Elephant Everyone Sees But Nobody Mentions
Two kilometres from the December 10, 2025 conference venue sits a £24 million energy centre with:
- 85% system efficiency
- Capacity for 88% with tri-generation
- 67% lower emissions than proposed alternatives
- Potential to eliminate 145 tonnes CO₂/year from cooling
- Infrastructure with 100-year design life
- Connected buildings desperate for low-carbon solutions
Nobody mentioned it. Not because they don't know it exists. Not because the data isn't available. But because acknowledging the elephant means questioning the entire policy framework.
The Question That Cannot Be Asked
"If our goal is net-zero by 2038, why are we abandoning the technology that could get us 67% of the way there?"
Because the answer is: "Politics, not physics."
KEY FINDINGS SUMMARY
The Numbers That Matter
|
Grid + Heat Pumps (Manchester's chosen path) |
266 kg CO₂ |
|
Biomethane CHP (abandoned option) |
87.5 kg CO₂ (67% lower) |
|
Biomethane CCHP (never considered) |
62 kg CO₂ (77% lower) |
Annual Impact (Civic Quarter)
- Projected emissions with heat pumps: 2,931 tonnes CO₂/year
- Potential emissions with CCHP: 953 tonnes CO₂/year
- Annual savings: 1,978 tonnes CO₂
- 30-year savings: 59,340 tonnes CO₂
- Equivalent to taking 12,900 cars off the road for a year
ABOUT THIS REPORT
This report represents independent analysis based on:
- Publicly available information from Manchester City Council reports
- Technical documentation from DESNZ and industry sources
- Direct observation of the December 10, 2025 heat network conference
- Standard engineering calculations and thermodynamic principles
- UK Government carbon intensity data (National Grid ESO)
All carbon calculations use conservative estimates and standard industry methodologies. Charts and visualizations are based on factual data and recognized engineering principles.
The Laws of Thermodynamics
Cannot Be Negotiated